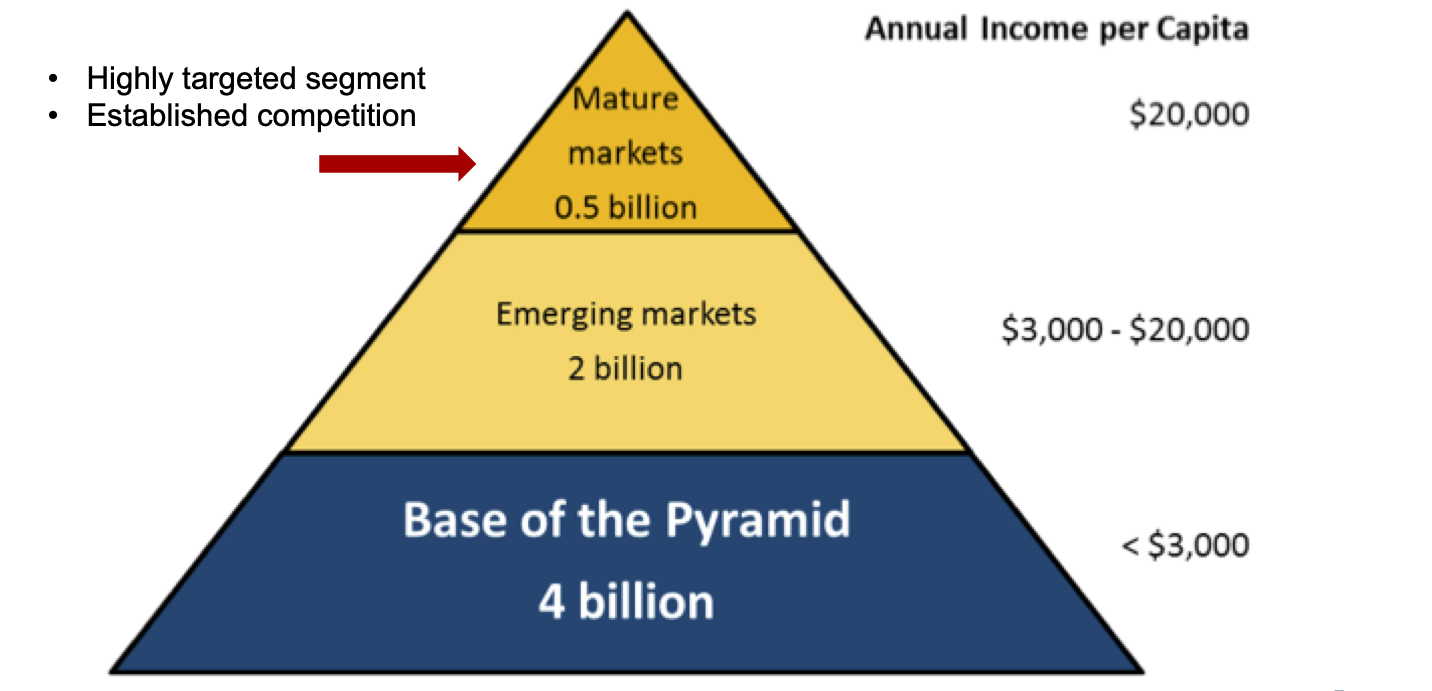
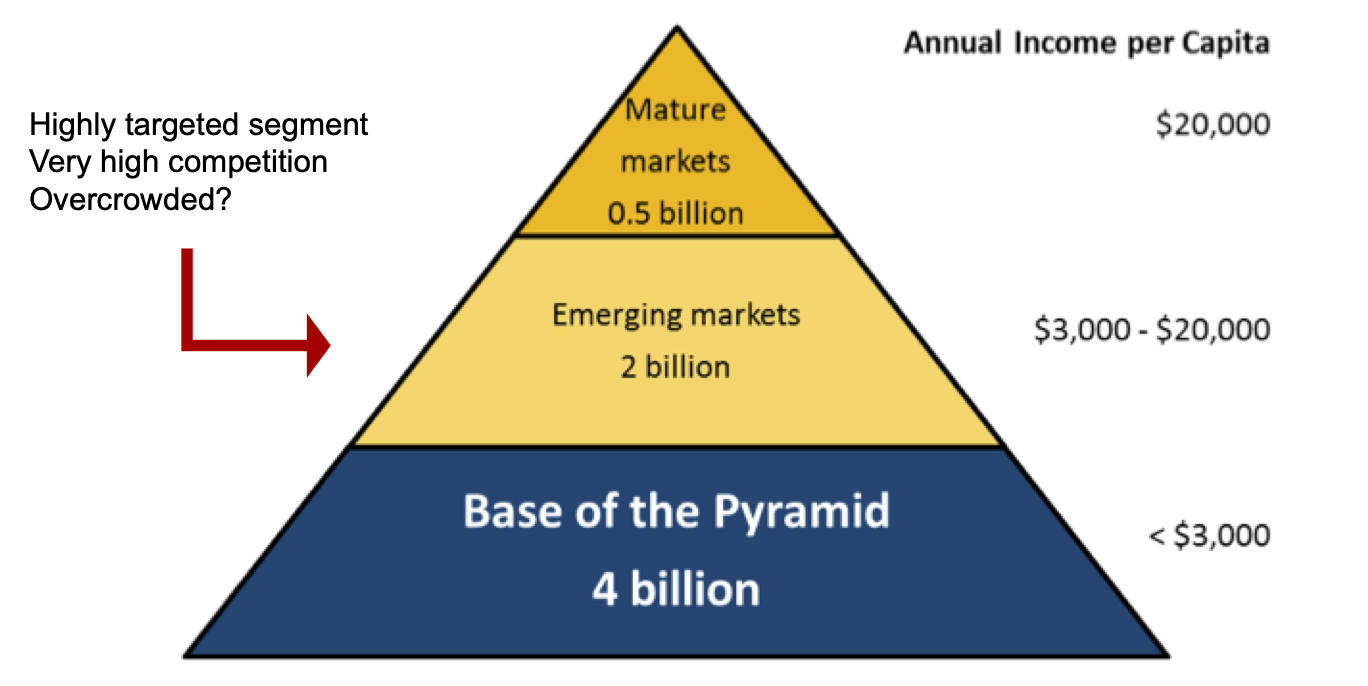
class: center, middle, inverse, title-slide # Emerging Markets, Base of the Pyramid, and Poverty Alleviation ### Thierry Warin, PhD ### quantum simulations<a style="color:#6f97d0">*</a> --- background-image: url(./images/qslogo.PNG) background-size: 100px background-position: 90% 8% # Navigation tips - Tile view: Just press O (the letter O for Overview) at any point in your slideshow and the tile view appears. Click on a slide to jump to the slide, or press O to exit tile view. - Draw: Click on the pen icon (top right of the slides) to start drawing. - Search: click on the loop icon (bottom left of the slides) to start searching. You can also click on h at any moments to have more navigations tips. --- class: inverse, center, middle # Outline --- background-image: url(./images/qslogo.PNG) background-size: 100px background-position: 90% 8% # outline 1. The Top of the Pyramid of Markets 2. Emerging Markets 3. Base of the Pyramid Markets --- class: inverse, center, middle # The Top of the Pyramid of Markets --- background-image: url(./images/qslogo.PNG) background-size: 100px background-position: 90% 8% # The Pyramid of Markets .center[ ] --- background-image: url(./images/qslogo.PNG) background-size: 100px background-position: 90% 8% # GDP (current US$) <!-- --> --- background-image: url(./images/qslogo.PNG) background-size: 100px background-position: 90% 8% # GDP per capita growth (annual %) <!-- --> --- class: inverse, center, middle # Emerging Markets --- background-image: url(./images/qslogo.PNG) background-size: 100px background-position: 90% 8% # Emerging Markets .center[ ] --- background-image: url(./images/qslogo.PNG) background-size: 100px background-position: 90% 8% # GDP per Capita (growth %), BRICS <!-- --> --- background-image: url(./images/qslogo.PNG) background-size: 100px background-position: 90% 8% # China: Still “Emerging”? - Strong growth of the middle class - They want computers, specialized consumer goods, and quality products. - Between 2009 and 2013, the market for luxury products grew at a rate between 16 and 20% per year. <img src="images/china.png" width="50%" height="50%" style="display: block; margin: auto;" /> --- background-image: url(./images/qslogo.PNG) background-size: 100px background-position: 90% 8% # Different Generations, Different Habits The second generation (consumers between 16 and 25 year-old) tend to adopt consuming habits closer to North- Americans and Europeans. <img src="images/2nd.png" width="70%" height="70%" style="display: block; margin: auto;" /> --- background-image: url(./images/qslogo.PNG) background-size: 100px background-position: 90% 8% # Differences Across China Growth of the middle class is moving across China. <img src="images/china2.png" width="100%" height="100%" style="display: block; margin: auto;" /> --- class: inverse, center, middle # Base of the Pyramid Markets --- background-image: url(./images/qslogo.PNG) background-size: 100px background-position: 90% 8% # Base of the Pyramid Markets <img src="images/pyramide3.png" width="70%" height="70%" style="display: block; margin: auto;" /> --- background-image: url(./images/qslogo.PNG) background-size: 100px background-position: 90% 8% # The Millennium Development Goals <img src="images/goal1.png" width="70%" height="70%" style="display: block; margin: auto;" /> --- background-image: url(./images/qslogo.PNG) background-size: 100px background-position: 90% 8% # The Sustainable Development Goals .center[ ]